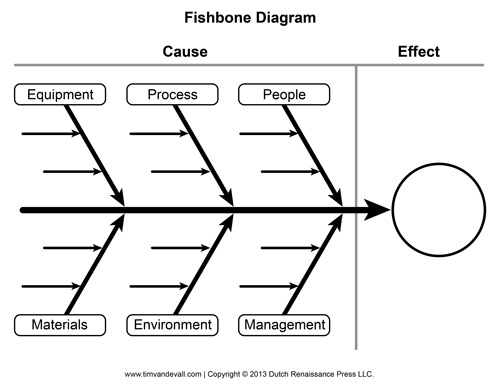
A fishbone diagram is an envisioning tool which shows the elements of an event and usually used in manufacturing and product making to figure out various steps in a procedure and describes where quality control problems might take place and decide which material goods are required at certain times. This diagram was first created by Kaoru Ishikawa in 1960’s. Therefore it is also known as Ishikawa diagram or cause and effect diagram. This diagram is called fishbone diagram because it has some resemblance of a fish skeleton, where the ribs represent the causes of an event and the ultimate conclusion appears at the head of the skeleton.
Make your own fishbone diagram by using fishbone diagram template. A fishbone diagram template allows to management to determine that which issues have to be discussed for the purpose of gain or avoid a specific event. Fishbone diagram template is a much systematic approach than other various tools available in order to meet mind showering causes of a problem. After the group has brainstormed all the feasible causes of a problem, the coordinator helps the group to estimate the probable causes according to their level of preference. Usually fishbone diagram work from right to left.
You are recommended to use our convenient fishbone diagram templates by which you can easily get your issues resolved. Further, fishbone diagram allows you a visual look at causes and effects. You can also customize your own fishbone diagram. Start by creating a head, which shows the problem or issues to be considered. Create a backbone of the fish which is straight line and leads to the head. Sort out four or more causes relevant to the problem which will create the first bones of the fish. Ty to use 5 W’s or any other questioning process to bring the conversation concentrated. Cover up all the causes that have been identified. Scroll down and click these thumbnails for your further perception.
